I need to log all data being sent over a COM port directly into a file for later analysis and debugging. I’m not sure what tools, drivers, or code patterns are best for capturing this serial communication reliably without losing data or impacting performance. What are the recommended approaches or utilities for monitoring and saving COM port traffic to a file on Windows?
Honestly, I’ve never seen a plug‑and‑play tool that just magically does this for you with zero setup. You’ll probably have to put a bit of work in.
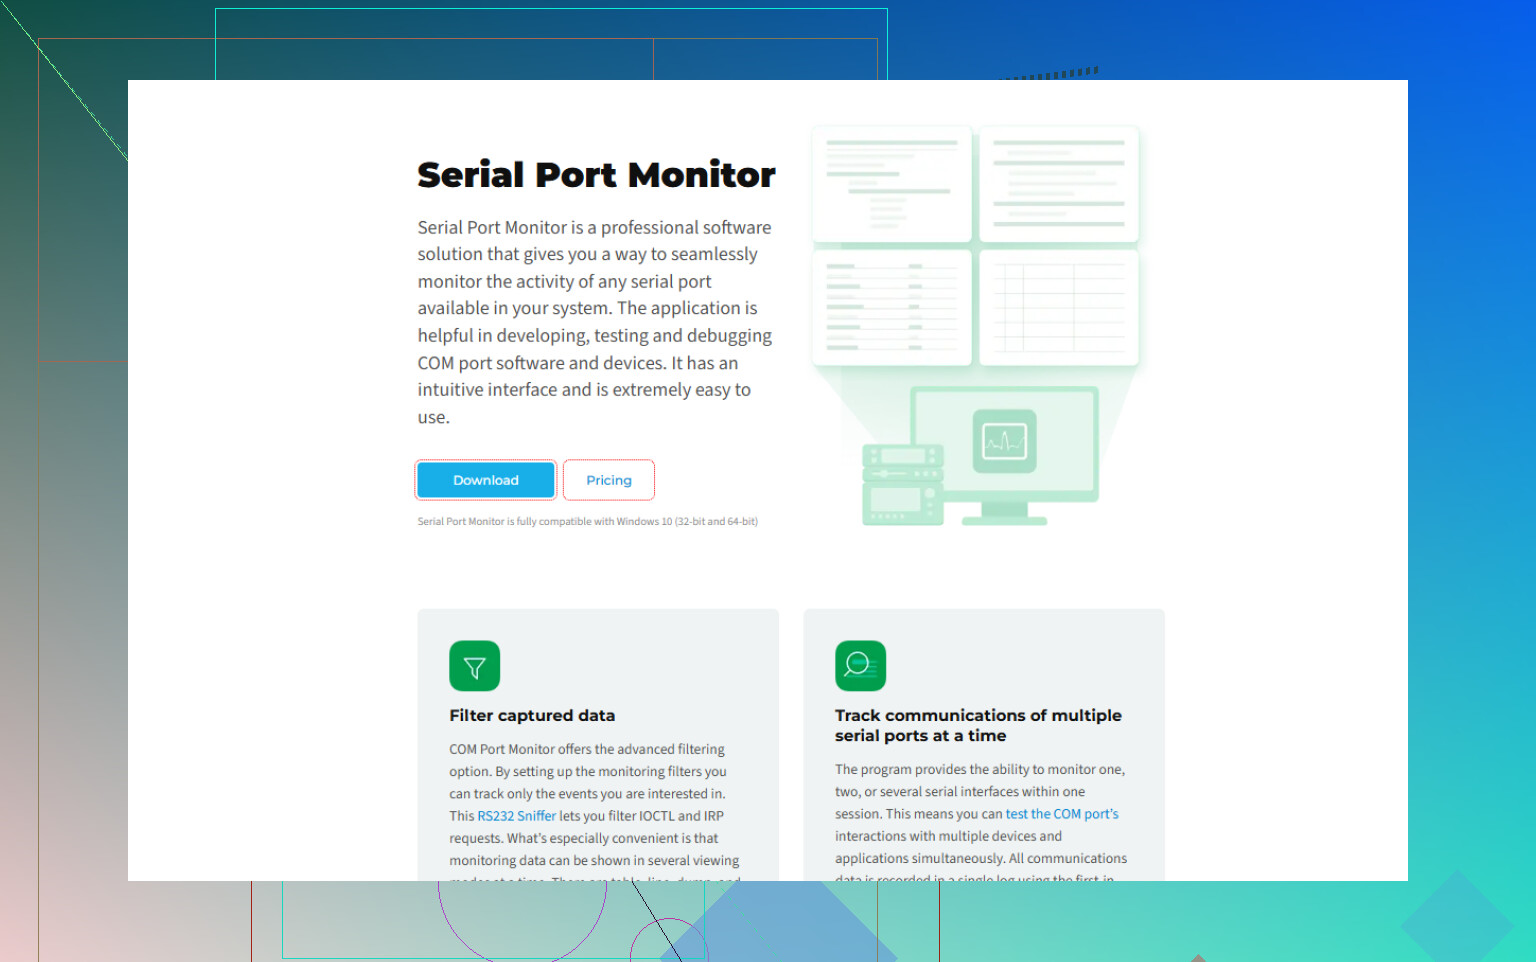
What I’ve used before is Serial Port Monitor:
https://www.serial-port-monitor.org/downloads/
It lets you watch what’s happening on a serial port and dump all that traffic into a file. Once you’ve got it installed, you don’t have to babysit the UI either. You can control it from the command line, which is what makes it usable in scripts or scheduled tasks.
So the rough idea is:
- Set up your monitoring session.
- Configure it to log to a file.
- Call it via command line with the options you need.
Not a one‑click miracle, but it gets the job done reliably.
7 Likes
Yeah, logging everything from a serial port straight to a file is absolutely doable, and you don’t have to rely only on what @mikeappsreviewer suggested, even though Serial Port Monitor is a solid pick.
If you’re specifically after continuous COM port data logging to a file for analysis and debugging, here are a few other practical routes:
1. Use a lightweight terminal app that logs directly
If you control one side of the communication:
- PuTTY, Tera Term, or RealTerm
- Open the COM port with the right baud / parity / stop bits.
- Enable session logging to a file (text or binary).
- Let it run in the background.
This works great if your app is not already using the COM port or you can redirect comms through the terminal app. The downside is they typically can’t “spy” on an already open port like a driver-level sniffer can.
2. Roll your own logger in code
If you’re okay with a tiny bit of coding, this is actually more reliable long term than juggling UIs:
- C# example pattern (using
System.IO.Ports.SerialPort)- Open
SerialPortwith port name & settings. - Subscribe to
DataReceived. - In the handler, read bytes and append them to a file with
FileStreamorStreamWriter. - Add timestamps, direction flags, etc, if needed.
- Open
Same idea applies in Python with pyserial:
import serial

ser = serial.Serial('COM3', 115200, timeout=0.1)
with open('com_log.bin', 'ab') as f:
    while True:
        data = ser.read(1024)
        if data:
            f.write(data)
            f.flush()
Not pretty, but rock solid and scriptable. This is what I usually end up with when I want something I can check in to git and replicate on other machines.
The catch: Your logger has to be the process that owns the COM port. It is not a passive sniffer.
3. Use a driver level “port splitter / sniffer”
This is where I slightly disagree with @mikeappsreviewer on the “no plug and play” point. Some tools are close to plug and play:
- Virtual serial port / sniffer drivers
- You create a virtual COM port pair (like COM10 and COM11).
- Your real app talks to COM10.
- The tool forwards data to COM11 and logs everything in between.
These sit between your app and the real device and can log traffic to a file without rewriting your app. Performance is usually fine unless you are pushing very high baud or tight timings.
4. Use a dedicated serial analyzer if timing is critical
If you need electrical level detail, bus errors, or exact timing that software tools fudge:
- Hardware serial analyzers can capture RX/TX lines and dump everything with timestamps into a file.
- Overkill for simple protocol debugging, but unmatched if your device is timing sensitive or randomly framing data.
5. If you want “install once, script forever”
Since you mentioned reliability and not babysitting it:
- Tools like Serial Port Monitor do fill that niche pretty well. Instead of the download link already posted, I’d start here:
advanced COM port data logging software
You can:
- Configure a monitoring session.
- Log to text, binary, or structured formats.
- Start / stop sessions via command line and wrap them in scheduled tasks or batch scripts.
That last bit is nice when you want to collect logs from field machines without giving users a UI to click through.
Quick summary pattern
If I had to pick:
- Need no code, want GUI + CLI: use Serial Port Monitor or a similar sniffer.
- Control the app and want minimal deps: write a tiny logger in C# or Python.
- Just need a simple dump from your own session: PuTTY / Tera Term logging.
- Need absolute timing: hardware analyzer.
So yes, monitoring serial port communication directly into a file is totally possible and common. The right approach depends on whether you can own the port directly or need to observe an existing app without touching its code.
Yeah, it’s absolutely possible, but it really depends on who owns the COM port and how transparent you need the logging to be. @mikeappsreviewer and @byteguru already hit a lot of the obvious stuff; I’ll try not to just rehash their steps.
A few extra angles to consider:
1. “Sit in the middle” without touching your existing app too much
Both of them mentioned sniffers and splitters, but the practical trick a lot of people miss is: restructure your setup so your main application connects to a virtual COM port, and the virtual layer forwards to the real device while logging everything.
This pattern is handy when:
- You don’t want to (or can’t) modify the existing software.
- You need to leave logging enabled for days/weeks.
- You want timestamps and direction (TX vs RX) recorded.
In that setup, your “monitor” behaves like this:
- App connects to COM10 (virtual).
- Virtual layer logs everything.
- Data gets forwarded to the real COM3 (physical).
That way your serial-capable application just thinks it is talking to a normal port.
2. Use a tool that you can actually automate
I somewhat disagree with the “no plug and play” vibe. It’s not zero-click, but once configured, some tools really are fire-and-forget for long‑term logging.
This is exactly where a proper Serial Port Monitor shines:
- Install it once.
- Create a monitoring profile (baud, parity, stop bits, filters).
- Tell it to auto-save to rolling log files (e.g. one file per day).
- Trigger start/stop from scripts, scheduled tasks or a service.
If you want an actually SEO-friendly phrasing for what you’re after:
“Continuous serial port data logger that captures COM traffic to disk for protocol debugging and long-term analysis.”
That’s basically the job description here.
You can grab a build of Serial Port Monitor here:
advanced COM port data capture for Windows
This lets you monitor multiple COM ports at once, log to text or binary, and avoid babysitting a GUI all day.
3. When your existing software already opens the port
Bit of a gotcha: if some legacy program already opens COM3 exclusively, most simple “terminal + logging” solutions won’t be able to attach. That’s where:
- A filter driver in the stack
or - A virtual port pair setup
becomes almost mandatory. Anything user‑space that wants to open the same port will usually lose the race.
Some Serial Port Monitor style tools install a driver that can observe traffic even when another app has the port open, which solves that specific pain. That part is worth more in practice than yet another Python logger script.
4. If you care about what gets logged, not just bytes
Everyone talks about bytes-in-a-file, but for debugging real-world protocols, you may want:
- Timestamps per packet or per line
- Hex + ASCII views
- Direction indicators (Host → Device vs Device → Host)
- Search / filter by bytes or strings
A generic logger you write yourself will capture raw bytes fine, but once logs get huge, you will want something that can parse, filter and re-view the traffic in different ways. That’s one place where a tool like Serial Port Monitor beats a homebrew “while True: read(); write()” loop.
5. Edge cases people forget
- High baud & noisy lines: software logging can mask framing errors and glitches. If your main pain is “why does this device randomly lose sync,” a hardware analyzer is more honest than any Windows logger.
- Binary protocols with framing: if you need to see packet boundaries clearly, use something that lets you define or at least visualize frames, instead of just dumping a raw stream.
TL;DR pattern I’d use in your place:
- If you can change the app: write a tiny logger wrapper around the serial code.
- If you can’t touch the app and need reliability: install a driver-level logger like Serial Port Monitor, set it up once, script it via CLI, and let it silently dump everything to files in the background.
- If timing & signal integrity are the suspect: get a hardware serial analyzer and log there instead.
So yes, logging all COM traffic directly to a file is not just possible, it’s pretty standard practice. The real decision is: do you own the port, or are you spying on someone else’s executable that does?
You basically have three realistic ways to log COM traffic to a file, and each fits a different level of control over the system.
1. If you can touch the code
This is the most reliable and least magical:
- Wrap whatever opens the COM port (e.g.,
CreateFileon Windows,SerialPortin .NET,pyserialin Python). - For every read/write, dump bytes plus timestamp and direction to a log file.
- Use a simple, append‑only format:
[2025-11-25 10:32:01.123][TX] 01 03 00 00 00 02 C4 0B
Pros:
- Zero driver weirdness.
- Easy to add protocol‑level context.
- Portable across OSes.
Cons:
- Useless if you cannot modify the app.
- Harder to attach to already running binaries.
This is where I slightly disagree with the “you’ll always need a tool” sentiment. If you own the source, a trivial logger wrapper beats any external monitor for clarity.
2. Driver / virtual‑port approach (transparent logging)
This is the angle @codecrafter walked through: sit in the middle so your app talks to a virtual COM that forwards to the real port.
Pattern:
- App opens COM_VIRTUAL instead of COM_REAL.
- Virtual layer forwards bytes to COM_REAL.
- Everything is mirrored into a log file.
Tools like Serial Port Monitor are essentially polished versions of this idea, plus a filter driver that can see traffic even when another app has already opened the port.
Pros of Serial Port Monitor
- Can attach to ports already in use, which plain terminal tools cannot.
- Driver-level capture means:
- RX/TX separation.
- Timestamps.
- Hex and ASCII views.
- Multiple ports at once.
- Good for long‑term, unattended logging with rotation.
- CLI control makes it scriptable for continuous data logging and regression runs.
Cons of Serial Port Monitor
- Extra driver in the stack, which can occasionally:
- Trigger paranoid antivirus.
- Add a tiny bit of latency in very tight real‑time setups.
- Learning curve if you only need a “dump to file” and nothing else.
- Overkill when you can simply add logging at the application layer.
Compared with what @byteguru and @mikeappsreviewer described, I’d say Serial Port Monitor is strongest when you need to spy on a closed‑source legacy tool or keep logs running for days with minimal human interaction.
3. Hardware tap when timing or signal quality matters
None of the software options will tell you if:
- Your RS‑485 bus has horrible reflections.
- The device is seeing framing errors that the OS smooths over.
- Intermittent wiring noise is causing bit slips.
For that, a hardware serial analyzer or logic analyzer with UART decode wins:
- Physically tap TX/RX lines.
- Log to PC storage.
- Correlate line glitches with byte errors.
Pros:
- Ground truth at the signal level.
- No dependency on OS, drivers, or ownership of the COM handle.
Cons:
- Extra hardware.
- More setup, less convenient for routine logging.
If your protocol problems look like “it works 99 percent of the time then randomly dies,” I would trust a hardware capture more than any software monitor, including Serial Port Monitor.
How I’d choose in practice
-
You own the code:
Add a logging layer right where you call read/write. Optionally complement it with Serial Port Monitor for occasional low‑level checks. -
Closed‑source legacy app, Windows, need transparent capture:
Use Serial Port Monitor to sit in the stack, log to rolling files, and control it via CLI or scheduled tasks. That directly fits your “monitor COM communication to a file” requirement. -
Suspect timing or electrical issues, or very high baud with strict timing:
Introduce a hardware analyzer, then optionally run Serial Port Monitor in parallel for a higher‑level, more human‑readable log.
That way you are not just logging bytes, you are picking the right layer to watch: application, driver, or physical.